FORECASTING SOFTWARE FOR GROWING BUSINESSES
Plan with data, not gut feeling
Test assumptions, set realistic goals, and build plans your team can execute with confidence.
Trusted by 20,000+ scaling teams


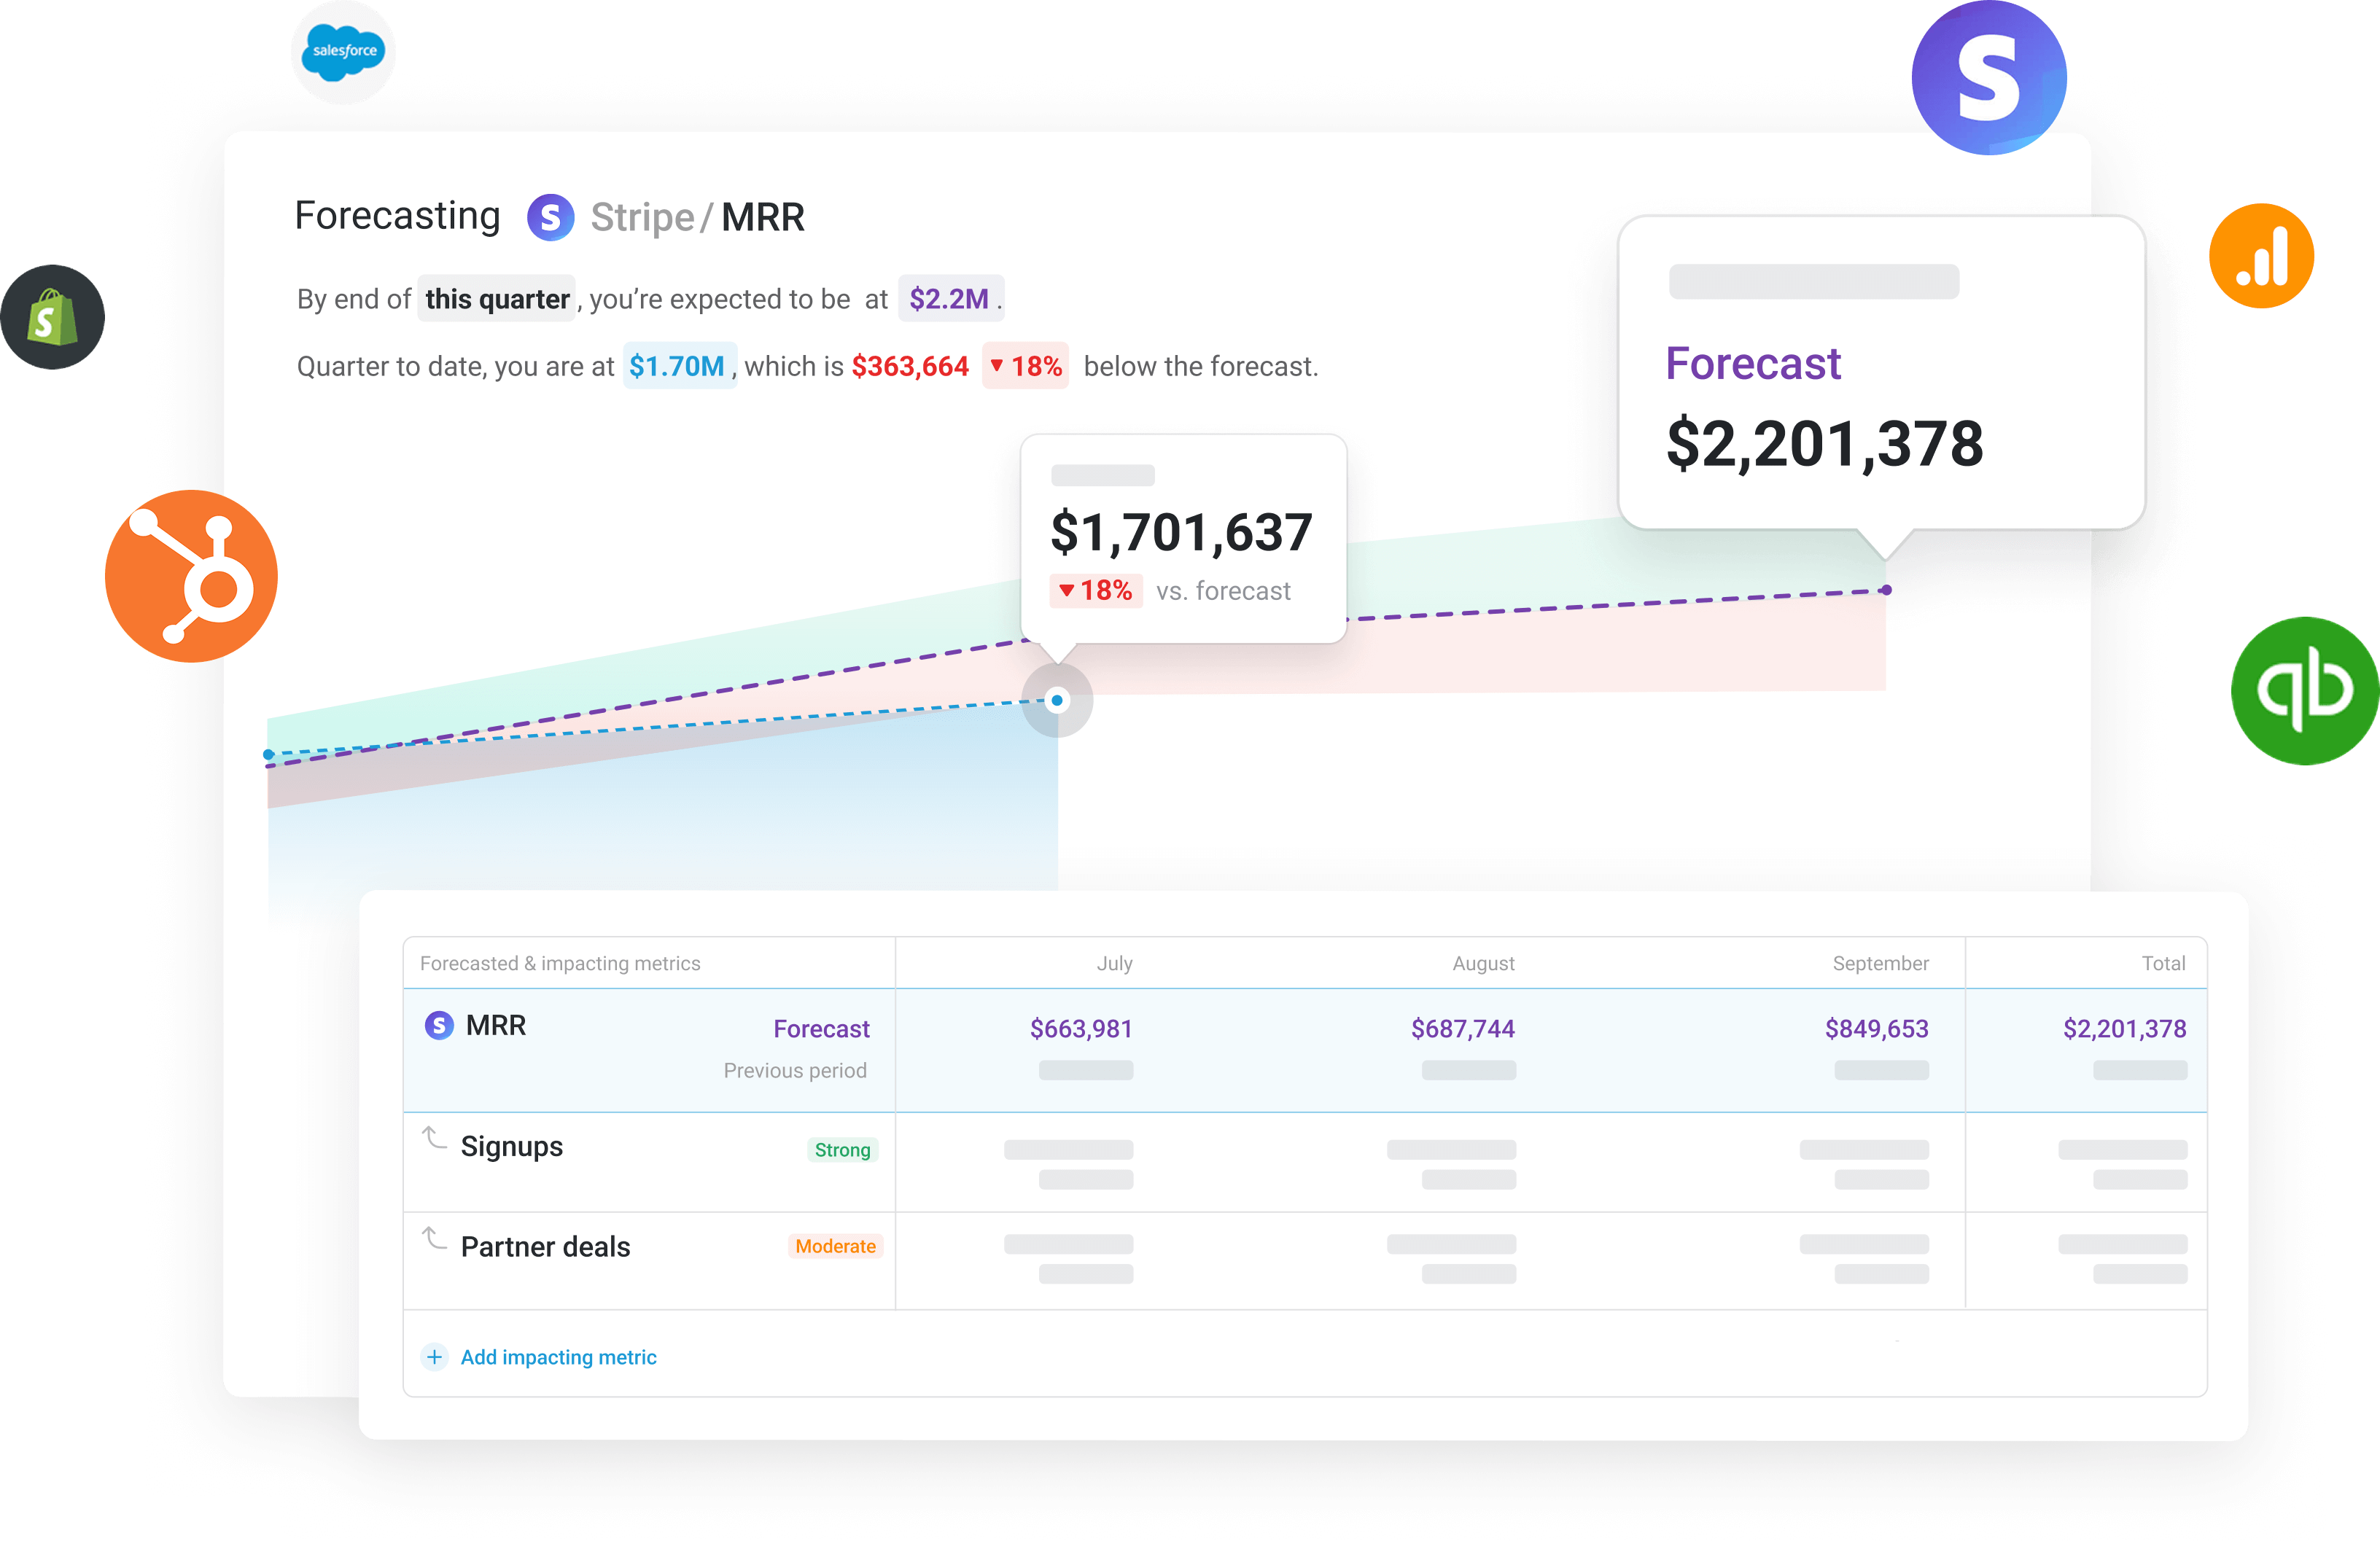
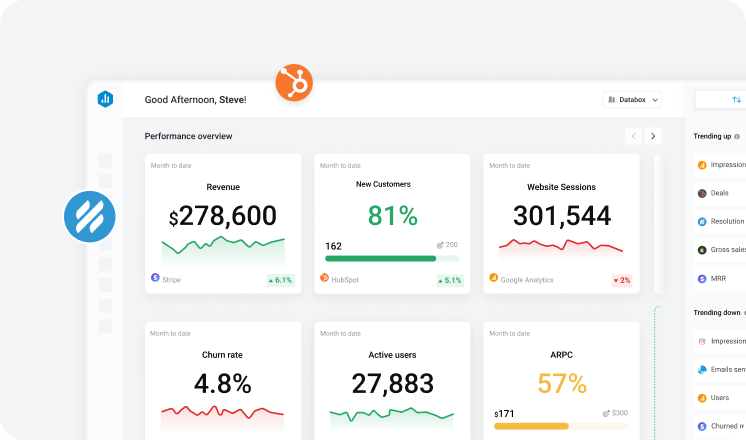
Set achievable targets backed by data
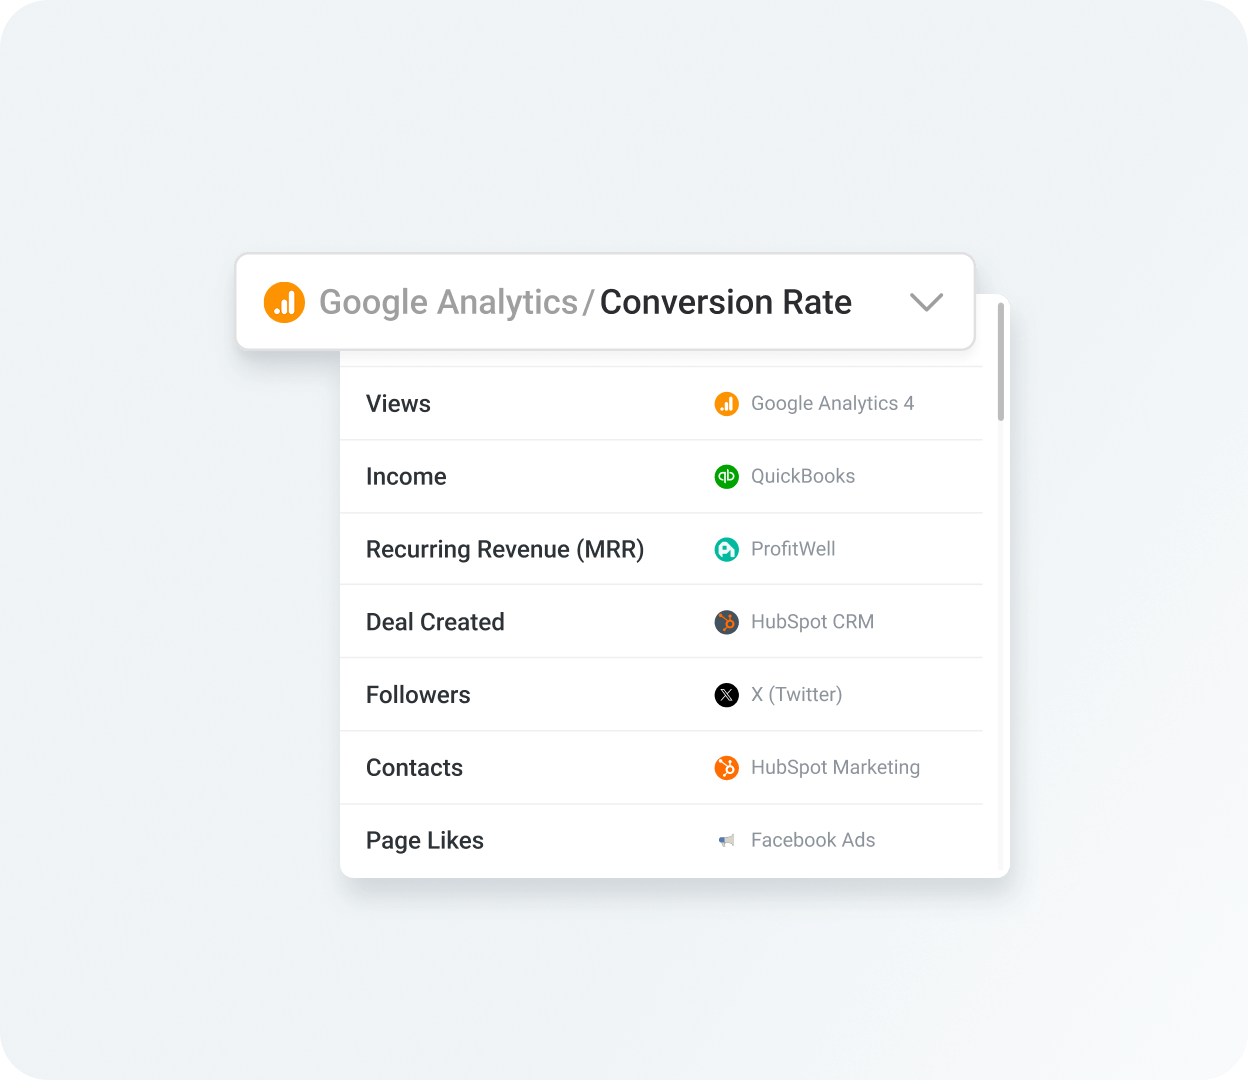
Forecast any metric
Sales can forecast Closed-Won Deals next month, while marketing forecasts website traffic next quarter.
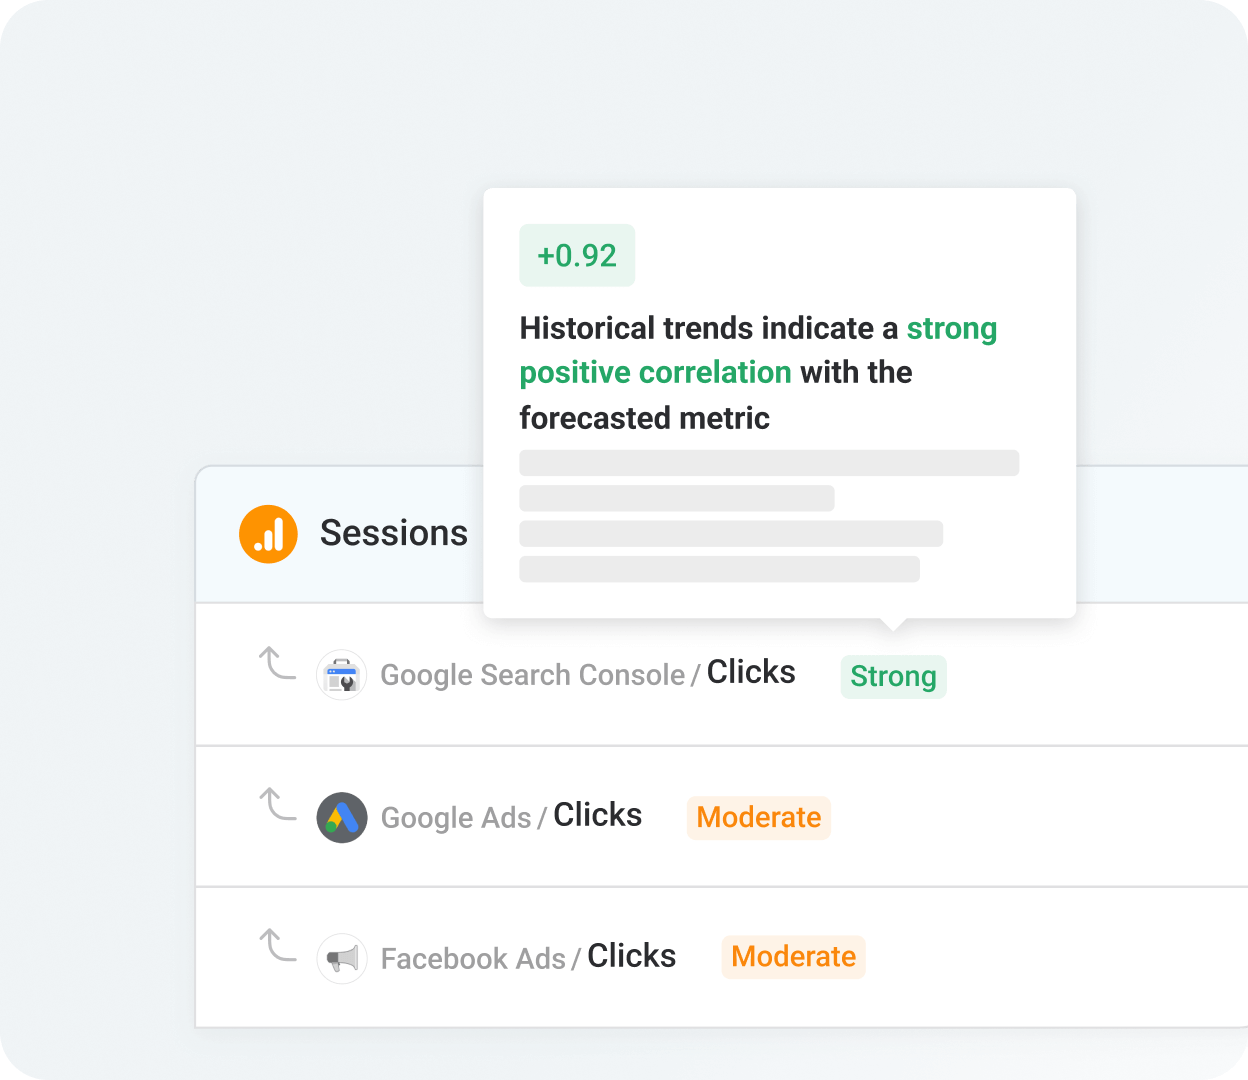
Identify what drives your results
Add the metrics you believe influence your main KPI, then see how they drive performance.
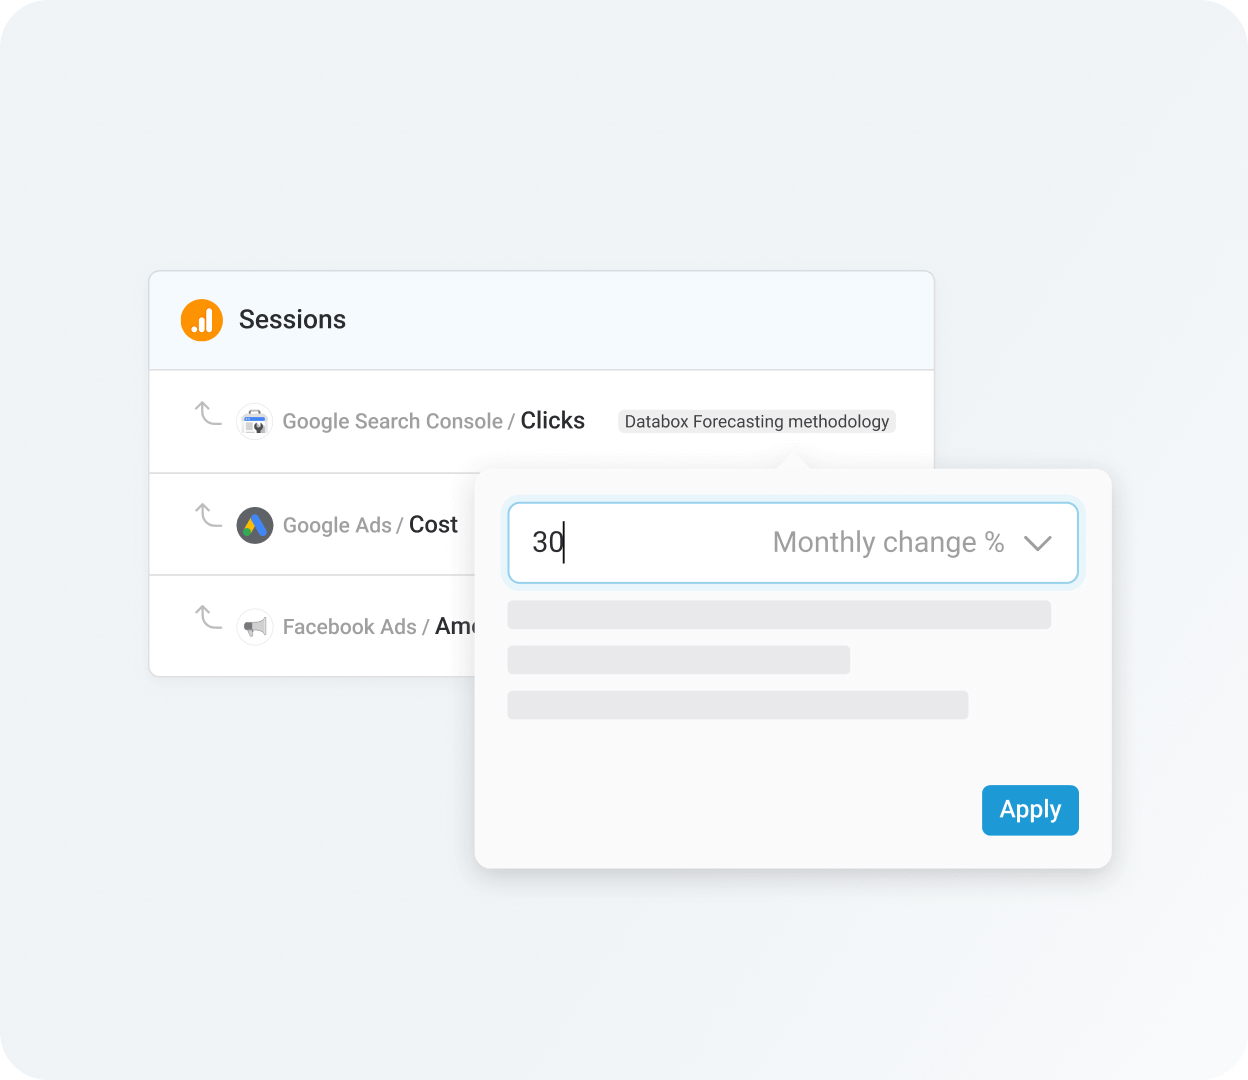
Test your assumptions before committing
Model increases or decreases in your metrics over time, so you can see how different plans play out and pick the best path forward.
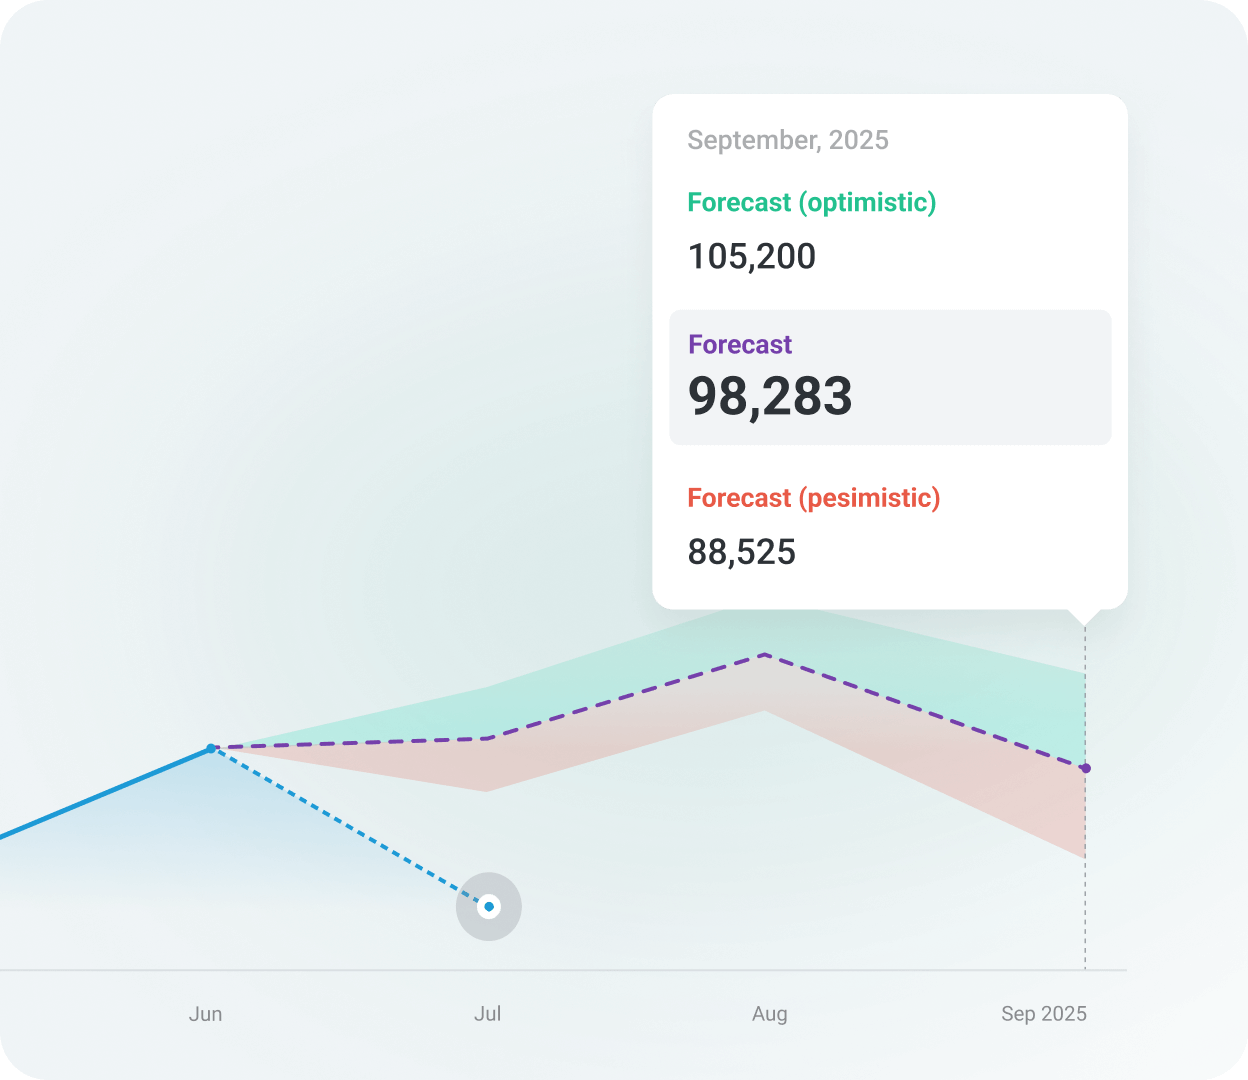
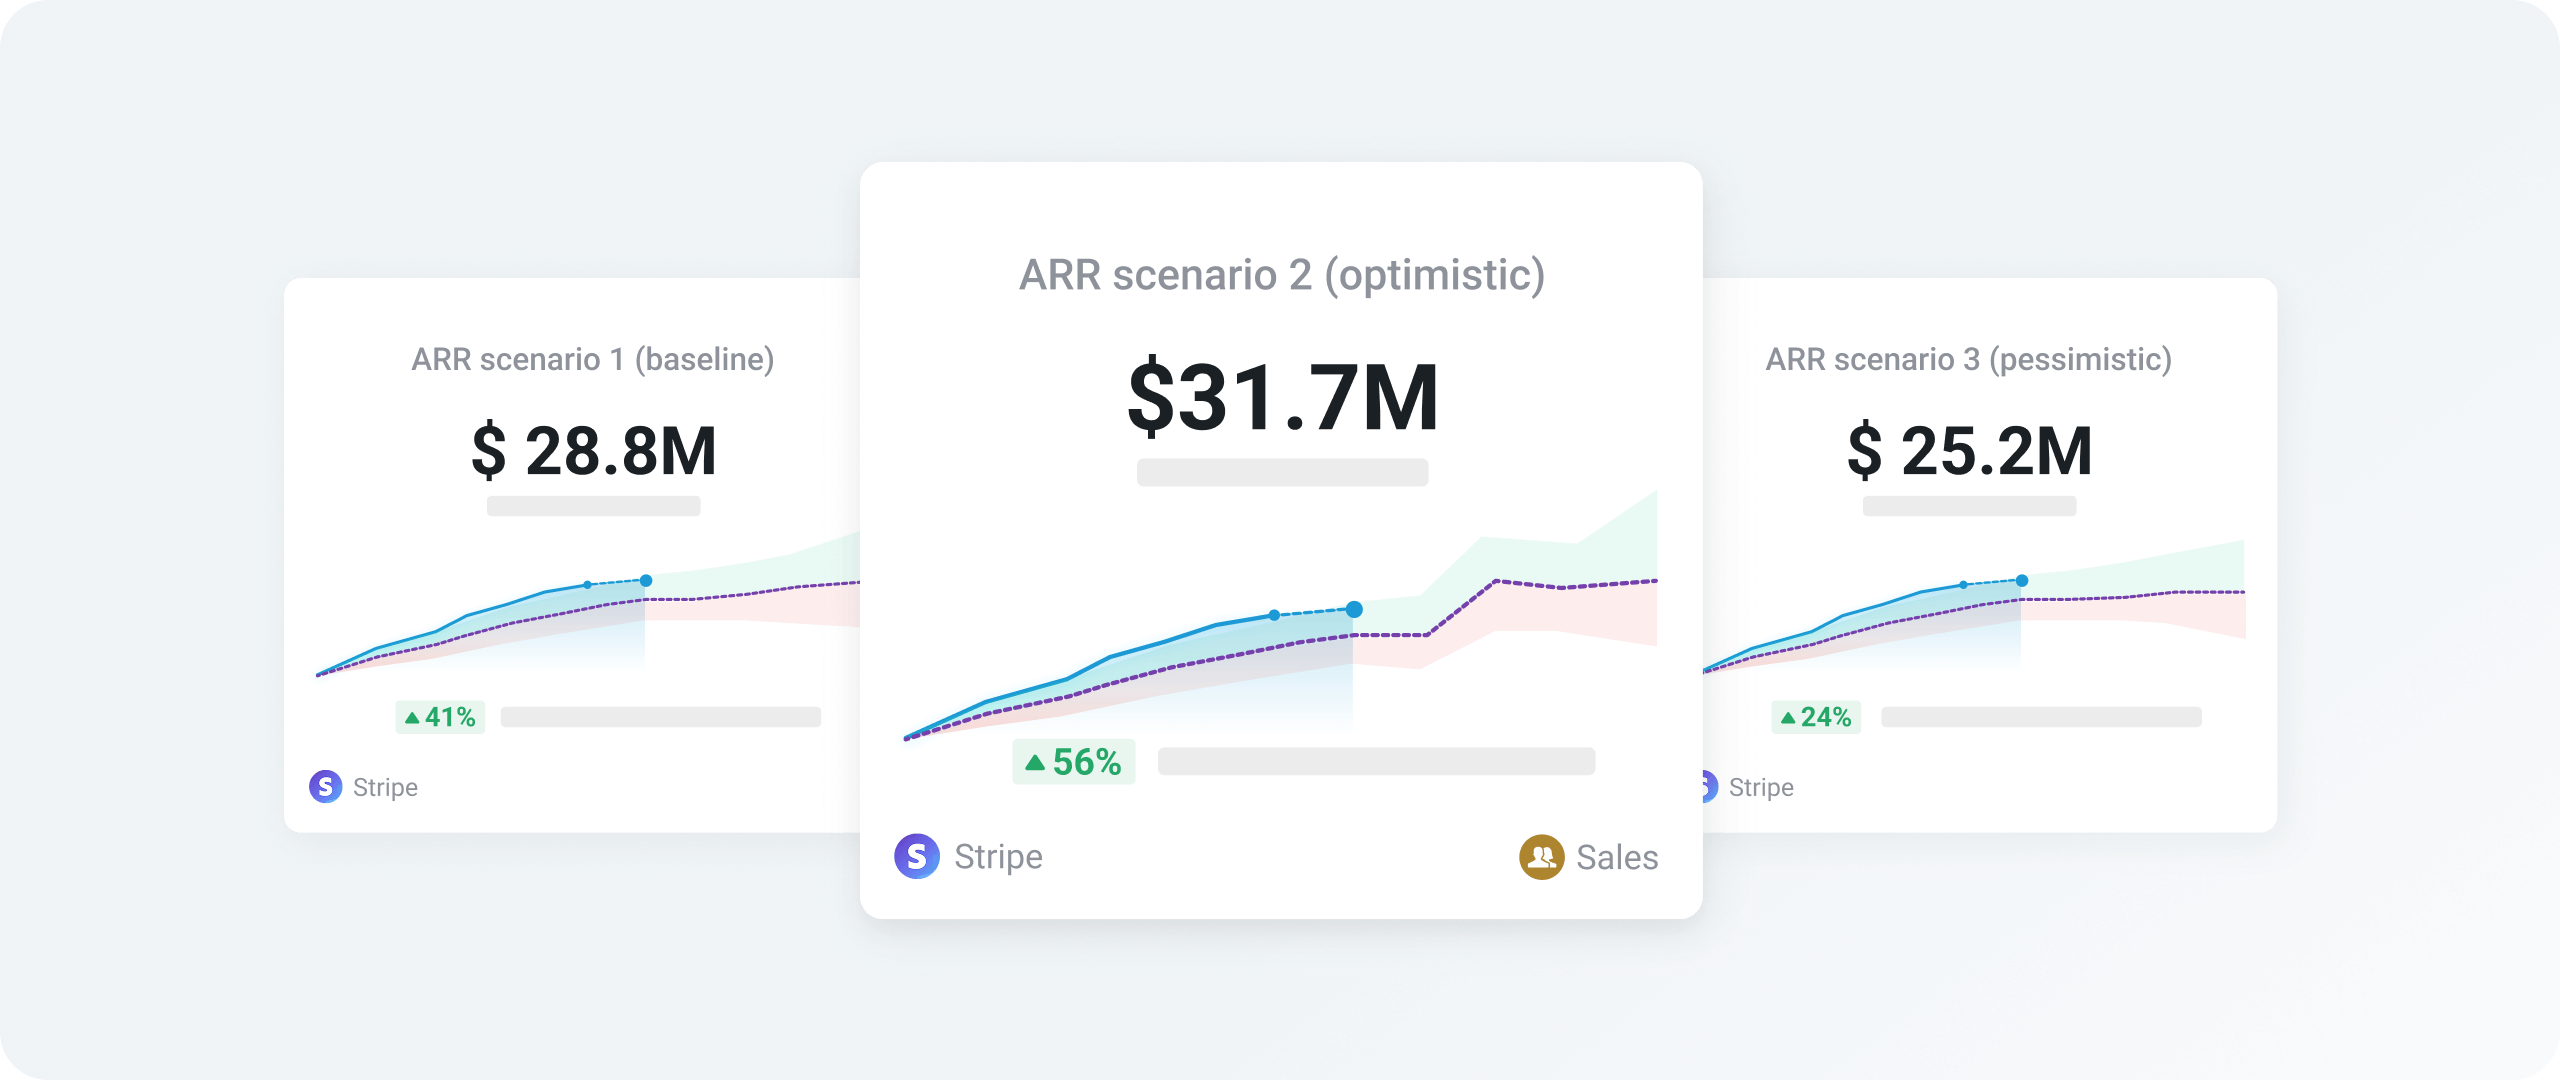
Plan for best, worst, and likely scenarios
Compare outcomes side by side to prepare for uncertainty and adjust quickly when things change.
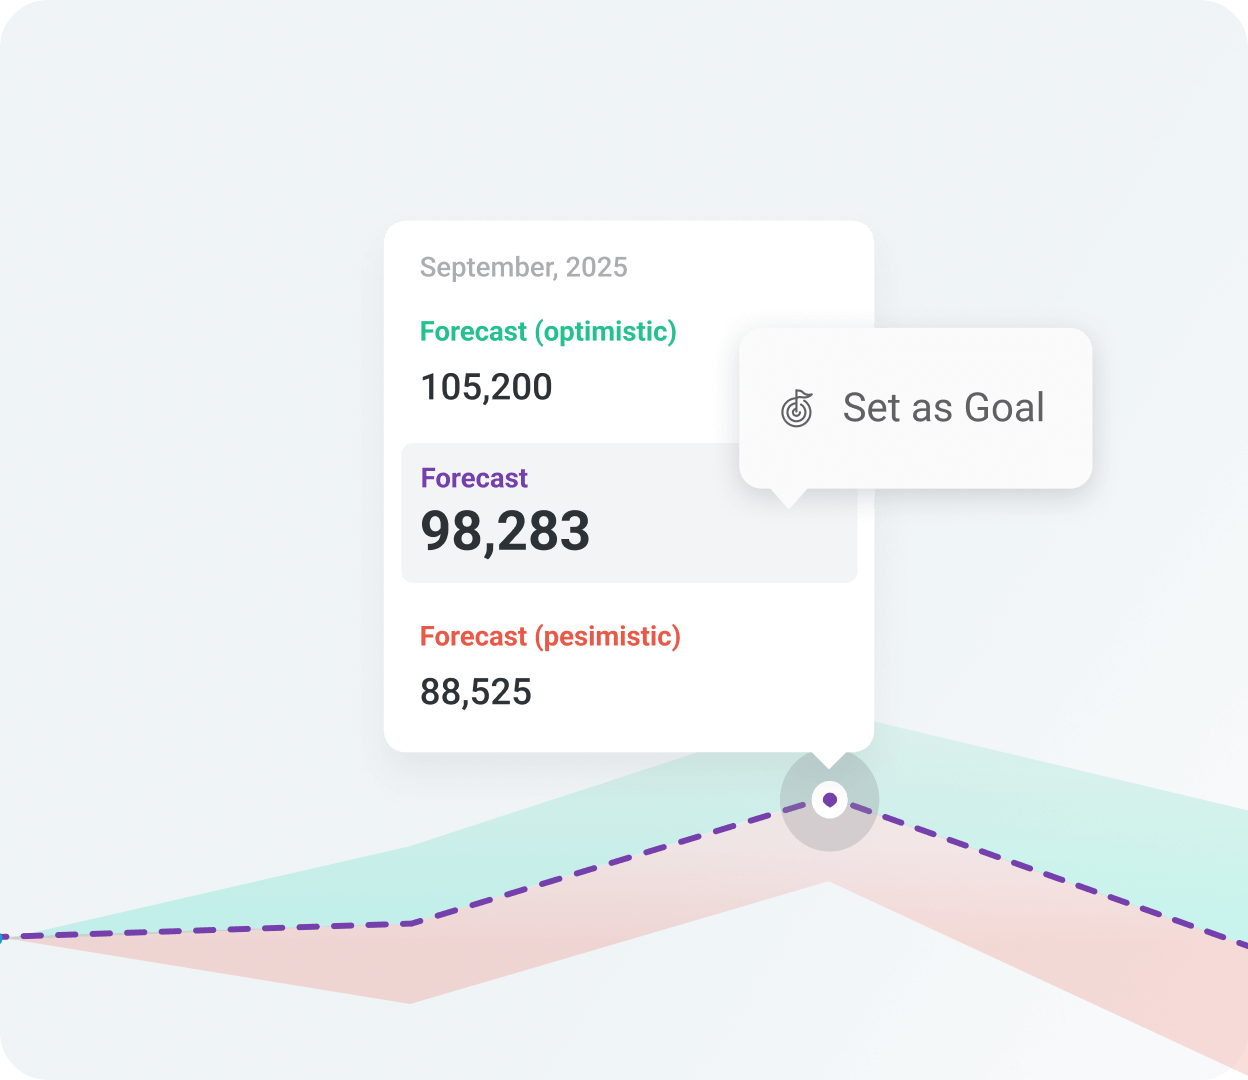
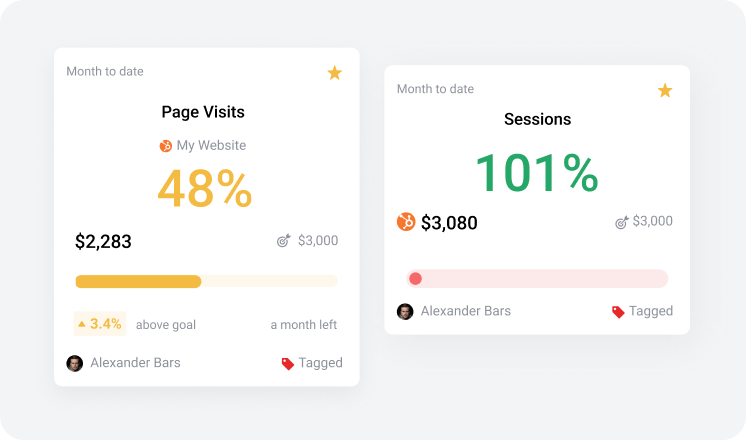
Keep plans connected to execution
Convert scenarios into goals and monitor progress in real time to stay accountable.
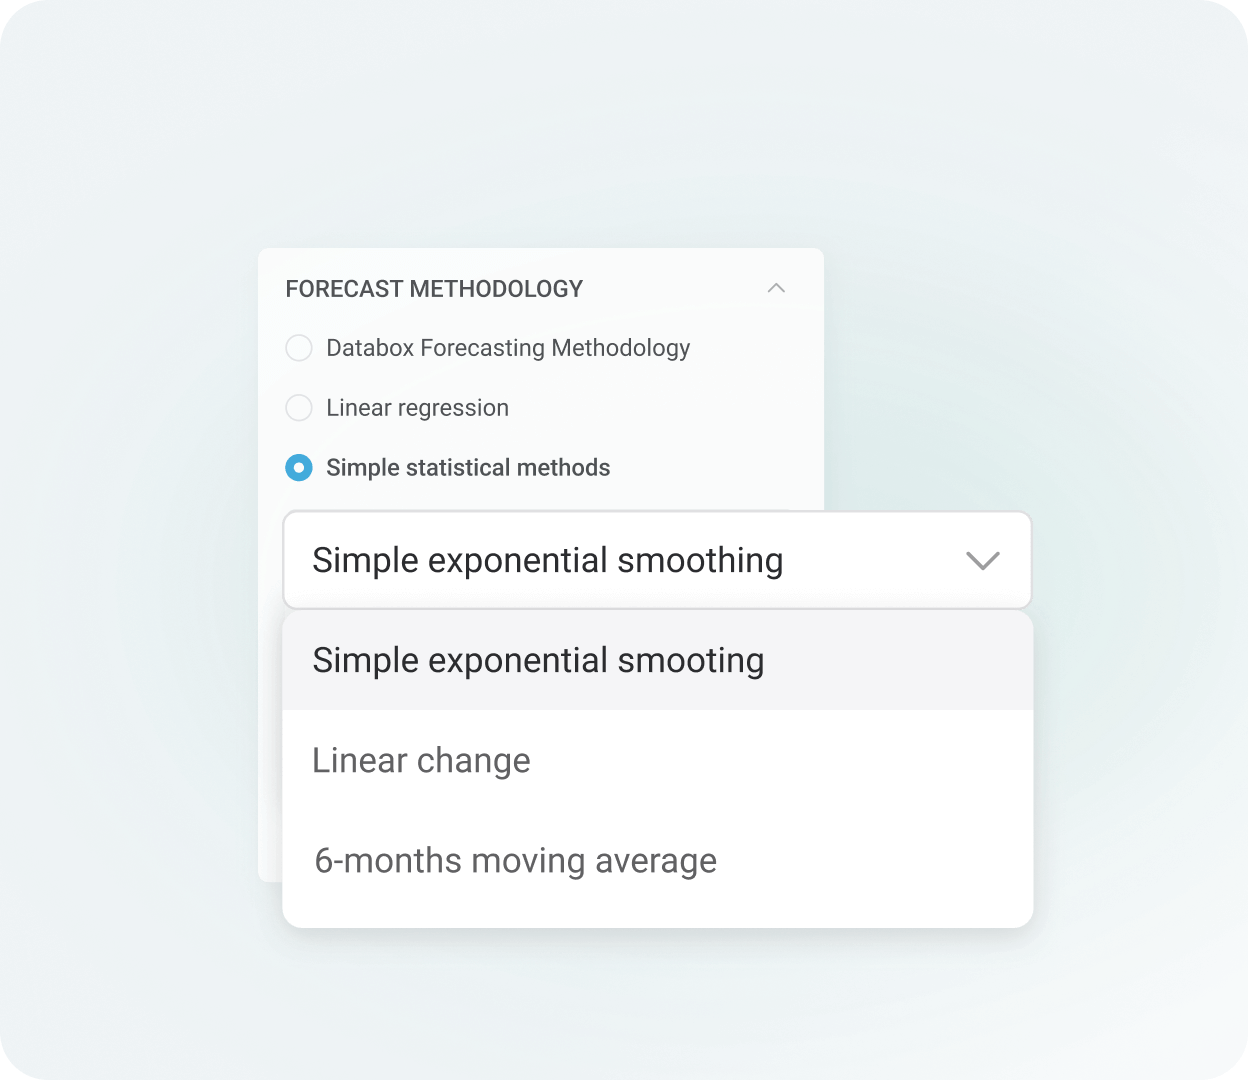
Choose the right method for your data
From trend-based to regression or smoothing, use the forecasting methodology that fits your business.
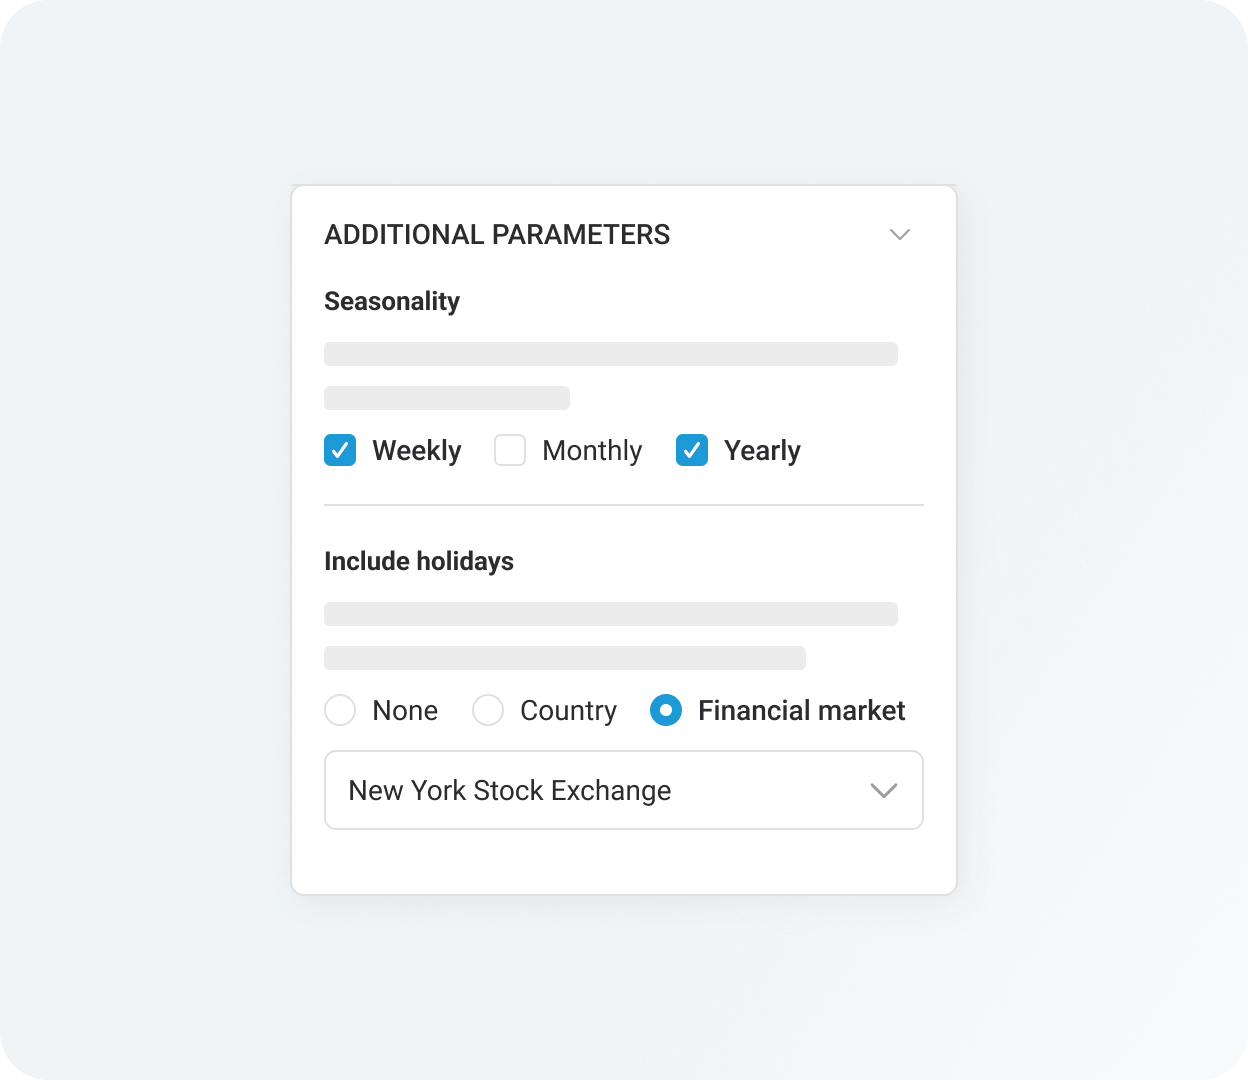
Account for holidays and seasonality
From trend-based to regression or smoothing, use the forecasting methodology that fits your business.
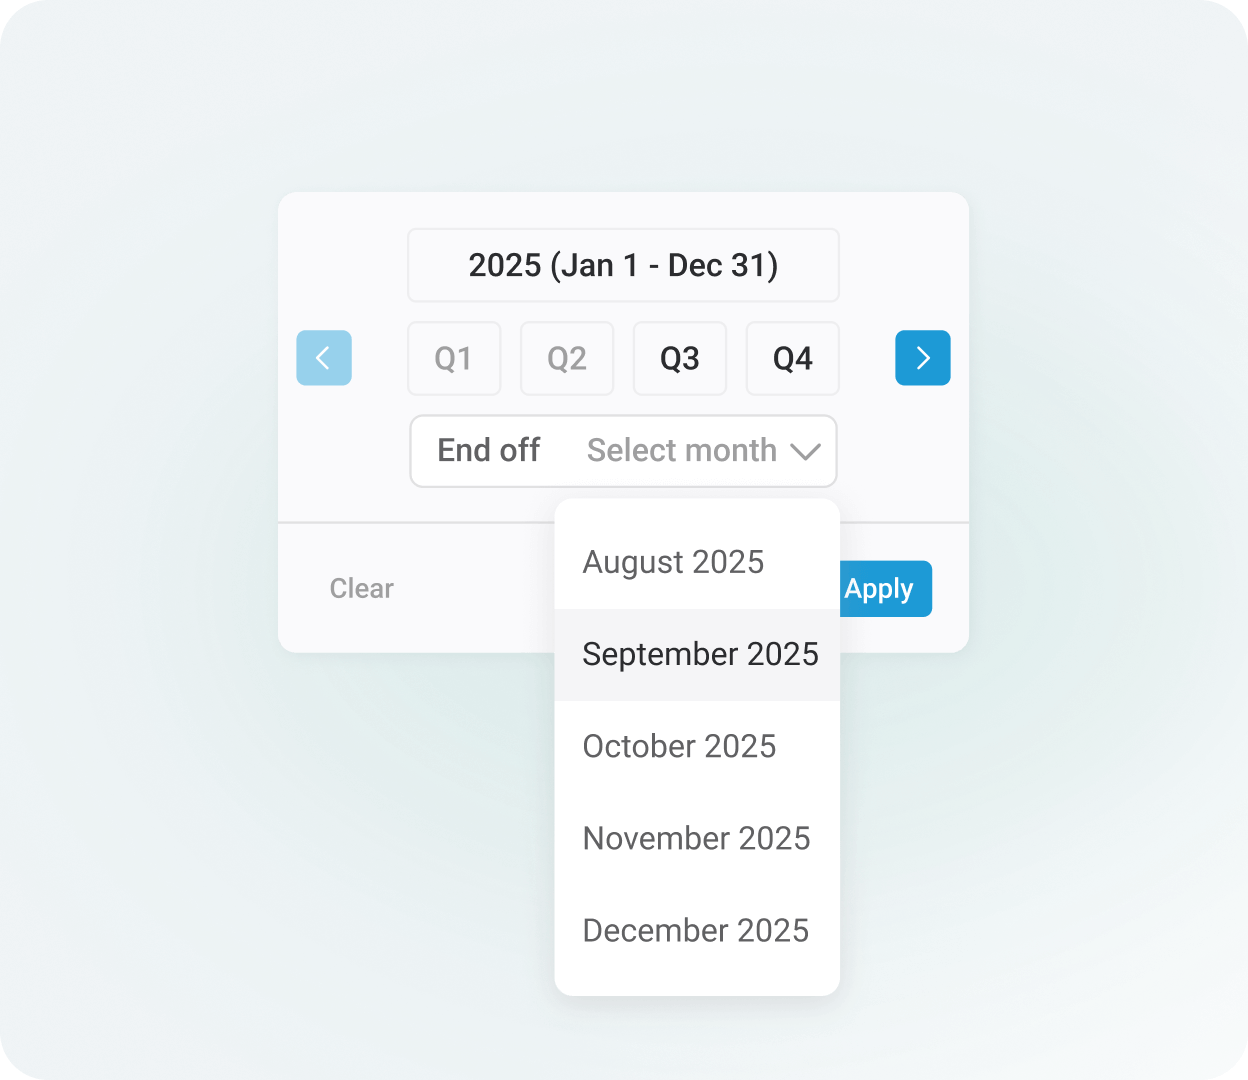
Match your team’s planning cycles
Forecast a quarter, a year, or the end of a period, and break it down by day, week, or month to match how your team works and plans.
Save and revisit scenarios
Keep different forecasting setups on hand, explore what-if scenarios, and refine as your business evolves.
Forecasts help us align year-end performance with goals. I’ve been using Forecast to predict inbound pipeline generation and other key marketing KPIs that I report on each month. In a recent meeting with my VP of Marketing, I used the graphs to tell a more compelling story about our 2025 planning and how we’ll finish the year from a marketing perspective. It’s helped us align our year-end performance with the targets and goals we set at the beginning of the year. Forecasts have been an incredibly useful tool, and we’re planning to leverage it more next year as we set new goals.”

Frequently asked questions
Aside from historical data, what does the Forecasts feature take into account to create accurate predictions?
Our predictive analytics tool leverages the Facebook prophets model. lt determines forecasts by analyzing historical data, seasonality, and machine learning models. You can learn more about our Forecasting Software here.
How much historical data do I need to create a forecast?
To create a Metric Forecast, you need a minimum of 12 months of historical data.
Can I customize my Forecast?
Yes. There are a few ways you can customize your Forecasts:
- Forecasting period: You pick from This Month, This Year, or any custom range between 1 to 24 months.
- Historical data: You can define the amount of historical data you want to show in your graph. You need to include at least 2 months of data.
- Graph settings: You can choose how you want the data graphs (by day, week, or month).
Can I add Forecasts to my dashboards or reports?
While you can’t add forecasts directly, you can easily save them as goals and then display those goals in your dashboards and reports.
Can I save my Forecasts?
Yes. You can save any forecast you create, so you can revisit it anytime and see exactly how your actual results are trending against your projections.
Start forecasting now
Product
Compare
Databox Inc.
HQ: Boston, MA, USA
Modern BI for teams that needs answers now
Databox Inc.
HQ: Boston, MA, USA

Modern BI for teams that needs answers now


Product
Compare